


July 28, 2026
Two Closed Corridors: Hormuz and Bab el-Mandeb Both Effectively Shut to Tanker Traffic


In mod(els) we trust

What’s inside?
Imagine you just finished building the most amazing box in the world. You can ask it any question, and it will give you the answer. It comes in any color – so long as it’s black. How much do you think you could sell it for? Squillions right? Okay, there is a catch – two, if I’m honest: first, it won’t explain the reasoning behind its answers; and second, it can only give you a yes/no answers. Still worth squillions?
As it happens, amazing black boxes like these do actually exist: today’s improvements in machine learning and deep learning are tremendous; the sky’s the limit in terms of what we can achieve using the clever algorithms they contain, and which are constantly improving. Indeed, every year, and even every month, there are new additions to – and versions of – these algorithms that enable users to handle problems in new ways, employing seemingly infinite amounts of data, as well as their own, personal experiences.
But we’re only human. If we’re to use the outputs of a model/algorithm/machine to support our decisions, we need to trust it. If it recommends where to eat, that’s fairly easy to trust (fake reviews notwithstanding) as the stakes (or steaks) aren’t that high. If the algorithms support us in our day-to-day work, influencing the way we process information to make decisions that may impact security, safety and the business itself, then we’re going to need a bigger boat of trust. Much bigger. Our job, as the data scientists standing behind these models, is creating this trust within our data science toolbox. Allow me to explain.
Explainability
A huge part of trust in an answer is understanding the WHY behind it. Recently, there’s been a surge of interest in a new field of research and implementation called Explainability. The need to know why, to unravel the reasons behind the black box’s answers, is common around the world and across all industries. What’s more, it’s not only for end users; data scientists themselves need tools to understand the model, and debug it. The trouble is, models are complex beasts; understanding why they do what they do isn’t simple.
Back in the olden days (all of 10 years ago and beyond) models were mostly linear: each feature contributed a specific weight to the final answer of the model. So it was simple to understand that if, say, a ship’s age had a heavy weighting, and the ship was old, age would be a key factor in the model’s final decision on this ship. Such models were easily explained, but their power was limited because they didn’t account for the interaction between multiple features.
Decision Trees
These days, many machine learning models are based on so-called “decision trees”: a concoction of several features whose interaction produces a specific risk, or answer. Take, for example, the combination of the following three features:
- had a detention (yes/no)
- average speed
- time spent in bad weather.
It may be that if the ship was detained, had an average speed of 15-20 knots, and spent more than 30% of its time in bad weather it would be considered high risk. This is like walking (or sailing) along a tree, where each decision about the value of the feature branches out into different paths (see image).
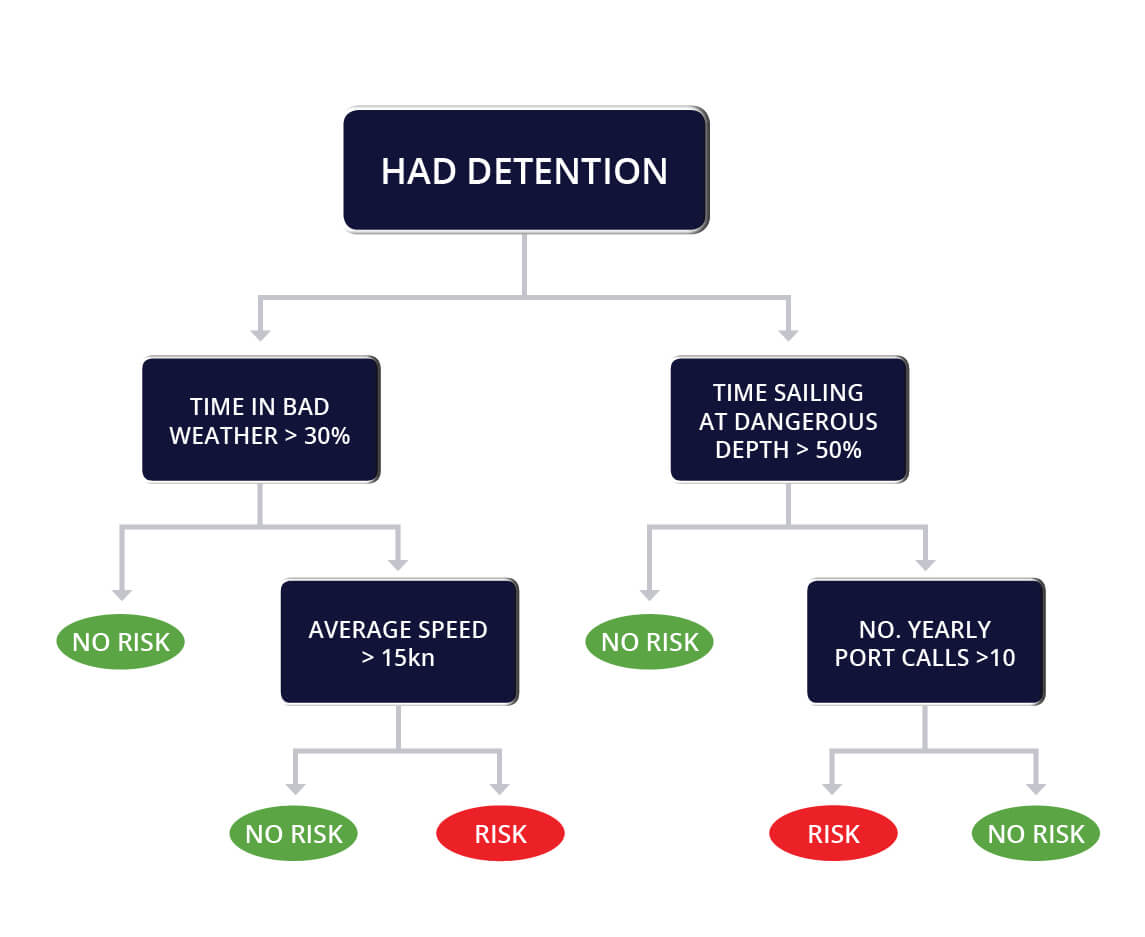
These are just three branches of a tree. Within which there could be several different walks, each of which lead to different outcomes. Confused? A full model can comprise around 100 such decision trees. Each ship will have a specific walk in each of the trees, and the final score, or decision of the model, will be a formula derived from all the scores it received in all the trees.
Final Score
Now let’s imagine that we want to explain the final risk score of a ship. The same feature can have a different impact on different trees. For example, the average speed of a vessel might mean everything to a tanker routinely operating in one area, and absolutely nothing for the same tanker if it were operating elsewhere. In other words, risk can be driven by different factors depending on the uniqueness of a situation, and there is no consistency in which an average speed of x knots adds 14.2 risk points. Doing so is practically impossible.
Luckily for us, it’s a global problem. Vast sums are being invested in seeking a solution. One answer found inspiration in Game Theory. Called SHAP, it stands for SHapley Additive exPlanations. I think it’s amazing!
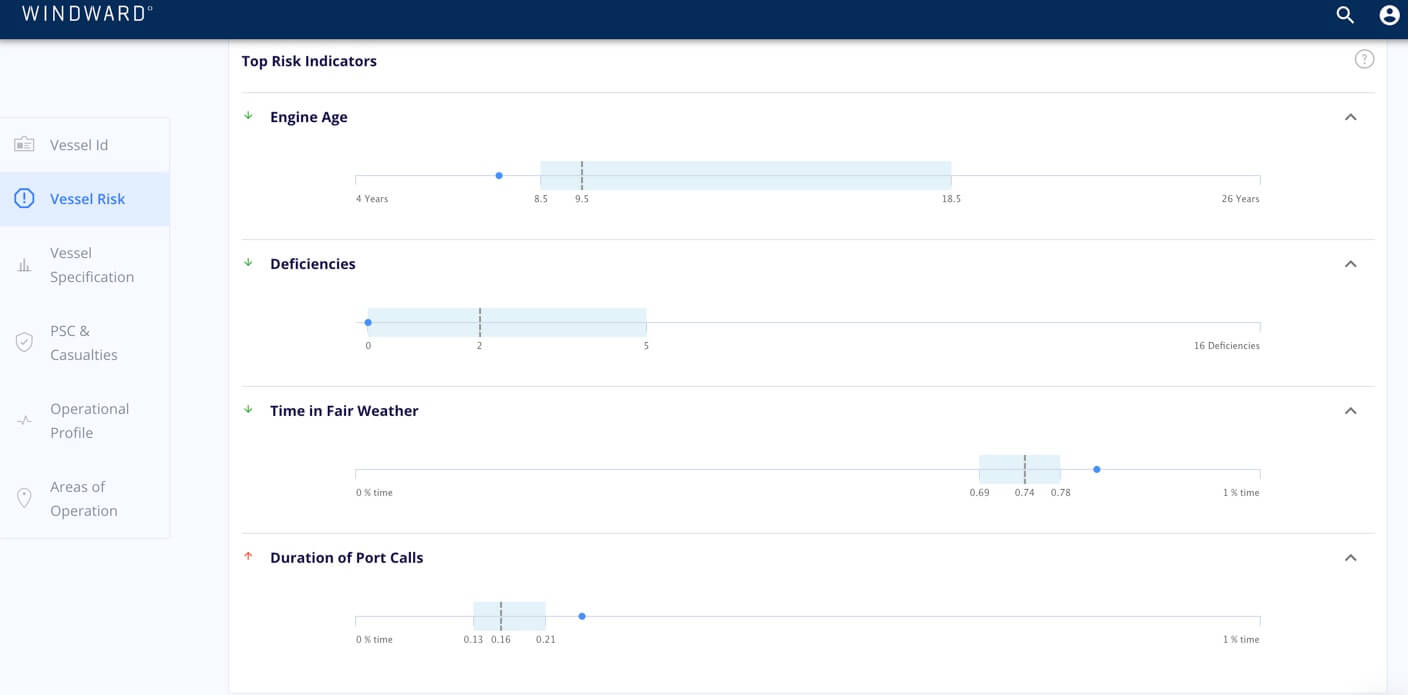
The idea behind SHAP is that we would like to know how much each feature contributed to the final score, or more precisely, how much a feature contributed in moving the score of the ship from the average score of all ships. We treat ship scoring as a game, where the players are the features that participate in the model. (To learn more, read this).
Explainability in and of itself, though, isn’t enough. Models can’t replace humans. Even if we choose to accept a model’s output and make a decision based on it, it is always our choice. Trust is achieved when the model and the user work in harmony. For that to happen, though, we need to provide the tools to understand the data behind the models. To be sure, models aren’t always right. But by empowering the user to make the final decision, he or she can verify the model’s output and complement it with their own expertise to help make the best possible decisions.
If you want to hear more about trust in machine learning models, and about how we use machine learning – and even deep learning – to predict the risk of a ship having an accident, come along to my next talk, at the MLConference, Berlin.
Yonit Hoffman is a Senior Data Scientist at Windward
Explore more

Introducing GPS Jamming Resilience: Cutting False Vessel Activity From Contested Waters
Windward is releasing GPS Jamming Resilience, a new platform capability that automatically identifies and suppresses the false vessel activity generated by GPS interference, before any of it reaches an analyst. It launches already proven. Since Operation Epic Fury began in late February, the capability has filtered more than 2.2 million false ship-to-ship (STS) meeting records...
Read more

Ground Truth: Windward’s 2026 Commitment to Verified Maritime Intelligence
By Ariel Zibziner, VP Business Services, Windward Data Integrity in an Era of High-Frequency Signal Manipulation As we conclude 2025, the maritime domain is characterized by a trust deficit in digital signaling. The convergence of major global conflicts — continued hostilities in Ukraine, Houthi attacks disrupting Red Sea transit, suspected infrastructure sabotage in the Baltic,...
Read more

Windward Launches WhatsApp Integration for Instant Risk Insights
At a Glance Redefining Vessel Screening for a Real-Time World In global trade and shipping, decisions are rarely made from behind a desk. A call from port control, a sudden request from a counterpart, or a time-sensitive deal can trigger the need for immediate screening. Whether it’s a compliance check to prevent sanctions breaches or...
Read more

Navigate 2025’s Maritime Risk Landscape with Maritime AI™ at London International Shipping Week
As the global shipping community gathers for London International Shipping Week (LISW) 2025, one reality stands out: disruption is the operating environment, not the exception. The maritime ecosystem is under sustained pressure, and adapting to this high risk era is now a prerequisite for business continuity. From sanctions and signal interference to fraudulent documents and...
Read more
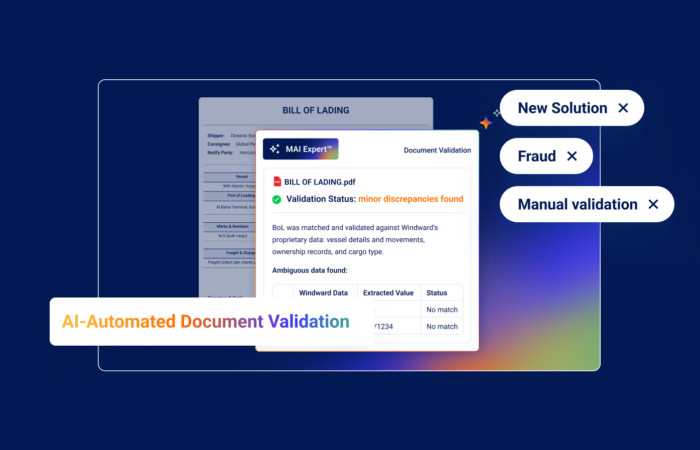
AI-Automated Document Validation: Streamlining Trade Against Real Maritime Activity
Global trade still runs on paper. Bills of Lading, certificates of origin, price attestations, and other documents remain the backbone of maritime trade, yet also its most persistent Achilles’ heel. Forged paperwork fuels fraud, delays compliance, and stalls cargo worth millions. Windward’s new AI-Automated Document Validation changes that, by cross-checking every document against what actually...
Read more