How Severe Weather Changed the Supply Chain – Maritime Global Trade Roundup
What’s inside?
Severe weather conditions near the crucial Cape of Good Hope seriously slowed container traffic this week and Hurricane Beryl also had a global impact. Two Windward insights show the power of weather events:
- There was a 41% decrease in area visits by all vessels in South Africa’s exclusive economic zone (EEZ) between June 30-July 7 and July 7-14
- There was a 455% increase in route deviations conducted in the Caribbean by container vessels between June 30-July 6, the week of Beryl’s formation
Windward can help you better understand the impact of weather on maritime shipping, empowering you to proactively plan for delays and disruption. This week’s roundup also looks at a new flag registry being used to avoid sanctions…
Severe Weather in the Cape of Good Hope Impacts the Supply Chain
- Severe weather conditions near the Cape of Good Hope have brought container traffic to a halt this week. The Cape of Good Hope became the most used route since the beginning of the Red Sea crisis, as circumnavigations through Africa have surged to avoid the Red Sea security threat.
Windward’s Early Detection model showed that following the weather change, there were several indicators and activities that correlated with the meteorological conditions. Between June 30-July 7 and July 7-14, there was a 41% decrease in area visits by all vessels in South Africa’s exclusive economic zone (EEZ). When examining container vessels specifically, data shows a 36% decrease in area visits by container vessels in the Cape of Good Hope.
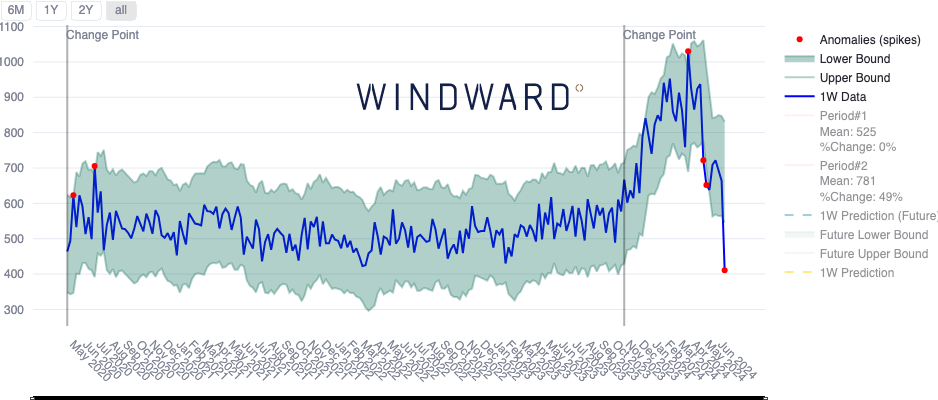

- During the same period, the Early Detection model shows a 520% increase in slow speed activities conducted by all vessels in South Africa’s EEZ, and a 100% increase in the duration of port calls by all vessels in South Africa. These data points show that vessels are trying to avoid sailing in severe weather.

Slow speed activities in South Africa by all vessels.

- Severe weather conditions can have a significant impact on the supply chain, and often cause shipping delays and further congestion, due to off-schedule arrivals. This is exacerbated by the Red Sea crisis and in this specific case, the widespread circumnavigation via the Cape of Good Hope. Windward’s Maritime AI™-powered insights can help you better understand the impact of weather on maritime shipping and proactively plan for delays and disruption.
Hurricane Beryl’s Impact
- Hurricane Beryl, which started as a tropical storm in the Caribbean, escalated and became a hurricane by July 1. It moved from the Caribbean to Houston, and throughout North America. On July 11, after arriving at Ontario, Canada, the hurricane dissipated.
Windward data shows that between June 30-July 6, the week of the formation of the hurricane, there was a 455% increase in route deviations conducted in the Caribbean by container vessels.
Course deviations by container vessels in the Caribbean Sea, January 1, 2023-July 6, 2024.
- Windward data also shows that between the weeks of June 30-July 6 and July 7-14, the week following the beginning of the hurricane, most container vessels conducted port calls in Kingston, Jamaica (32%), Freeport, Bahamas (12%), Caucedo, Dominican Republic (10%) and Cartagena, Colombia (8%) on a weekly basis. The data may suggest that vessels preferred to stay in the Caribbean and entered ports in the area as the hurricane further progressed inland, instead of rerouting to other ports.
- Looking at the larger picture, Windward data shows that in the week following the hurricane, port calls by container vessels in Houston decreased on a weekly basis by 38%. However, last week’s data shows that port calls by container vessels increased by 50% in Long Beach and Oakland in the West Coast, and the ports of Miami and Palm Beach in the East Coast. The data suggests that vessels might either wait near the ports of the U.S. Central Coast for arrival, or that they changed their port of destination to ports nearby, which might cause the sudden increase seen last week.
Port calls by container vessels in Long Beach, Oakland, Miami and Palm Beach, January 1, 2023-July 13, 2024.
Use of the San Marino Flag Registry to Avoid Sanctions
- The San Marino ship registry officially opened its door to international ship owners in July 2021 and it was included as one of the landlocked flag registries that are considered “flags of convenience” by the ITF. In some landlocked countries, such as Estawini (formerly known as Swaziland), such flags can be used by bad actors due to the ease of registration and the lack of supervision.
- Windward data shows that there are 16 merchant vessels (cargo and tankers) in total that are using the flag of San Marino as of July 2024, 56% of which are bulk carriers, 19% are LPG tankers, 13% are crude oil tankers, and 12% general cargo. Interestingly, Windward data shows that all 16 vessels are flagged for sanctions compliance risk by Windward – 53% moderate risk and 47% high risk.
- While the trend of switching to the flag of San Marino started for merchant vessels around July 2023, when most vessels seem to have registered under San Marino in May 2024, according to Windward’s insights. Based on the historical data, 38% of all vessels had a previous flag of Marshall Islands, 25% Panama, 13% Barbados, 12% Liberia, and 6% Bahamas and Belize, respectively.
Flag changes conducted by tankers and cargo vessels to the flag of San Marino, January 2023-July 2024.
- Further examining the vessels shows that 69% are flagged for being affiliated with Russia – most of these flagged vessels are bulk carriers and LPG tankers.
- To fight exploitation of the flag, the General Director of San Marino’s flag registry noted during Posidonia 2024 that they will work with the main flag registries (Liberia, Panama and Marshall Islands) to exchange information. The San Marino authorities may refuse registration under its flag, or even de-flag vessels under suspicion for sanction breaching to keep their flag registry legitimate. This occurred in the past with Gabon’s flag registry.

