Reports

Top 7 Geopolitical Disruptions in Q3 2025

In Q3 2025, sanctions, tariffs, and trade wars have amplified risk across global shipping, splitting trading fleets and shattering records for deceptive vessel practices.

The maritime sector now sits at the frontline of an unprecedented foreign policy experiment. One that has fueled flag-hopping, GNSS manipulation, and other deceptive behaviors to new extremes.

A stateless fleet of tankers and gas carriers, operating beyond the reach of international law, has emerged as a critical maritime safety and security threat. European intelligence even reported shadow fleet tankers being used for drone reconnaissance in the Baltic.

The number of falsely flagged ships has doubled in the past nine months, driven by record sanctions from the EU, UK, and U.S. since 2023 — and this quarter, surpassing 1,000 vessels for the first time.

Geopolitical exposure is increasingly difficult to gauge as regulators expand their focus to include enablers of sanctions circumvention, amid widening policy gaps between the EU, UK, and U.S.

For the second consecutive quarter, the U.S. imposed no new sanctions on Russian shipping, instead intensifying its “maximum pressure” campaign on Iran.

Meanwhile, the EU and UK jointly lowered the G7 oil price cap on Russia by 15% in September. From January, the EU’s ban on petroleum products refined from Russian crude — aimed at curbing “laundering” via India and Turkey — will redirect an estimated 200,000 bpd of gasoline and reshape global clean oil trades. Similar restrictions are under consideration elsewhere.

U.S.–China trade tensions have further disrupted supply chains, triggering counter-seasonal trade flows and the repositioning of global fleets ahead of the October 14 imposition of U.S. port tariffs on Chinese-built, owned, or operated vessels.

China’s retaliatory port tariffs on U.S. ships add a new layer of volatility for dry bulk and tanker markets, and fresh uncertainty for U.S.-listed shipowners.

Vessel & Company Sanctions 


  • In Q3 2025, the number of vessels sanctioned by the EU, UK, and U.S. since 2023 surpassed 1,000. 
  • Greater EU–UK alignment and the ongoing crackdown on Russia’s shadow fleet reduced the number of newly sanctioned vessels in Q3 2025.
  • Together, the UK and EU designated 311 Russia-trading vessels in Q3, bringing their totals to over 540 and 480, respectively. Of these, 369 overlap. The U.S., meanwhile, has imposed no Russia-related shipping sanctions since January of this year.
  • Record vessel blacklistings last quarter were driven by the EU’s 18th sanctions package on Russia, the UK’s addition of over 200 ships, and the U.S. Treasury’s largest Iran-related action since 2018, which targeted more than 60 vessels. (UN snapback sanctions on Iran were excluded from these figures.)
  • Notably, among the 60 vessels was a fleet of over 20 Iran-calling containerships, signaling that the U.S. Office of Foreign Assets Control is now scrutinizing Iranian seaborne trade beyond oil and gas.
  • Quarterly growth in the cumulative number of vessels sanctioned by the EU, UK, and U.S. slowed to 15%, down from the record 35% expansion in Q2. Still, the total number of sanctioned ships across these authorities remains 3.7 times higher than a year ago.


  • The number of newly designated companies by global regulators doubled compared with Q2 2025.
  • 58% of newly sanctioned companies were based in just two countries — the UAE and the Marshall Islands — reflecting the dominance of Russia-related sanctions in Q3.

GPS Jamming


  • More than 11,600 vessels worldwide were affected by GPS jamming in Q3 2025 — a slight decrease from 13,000 in the previous quarter.
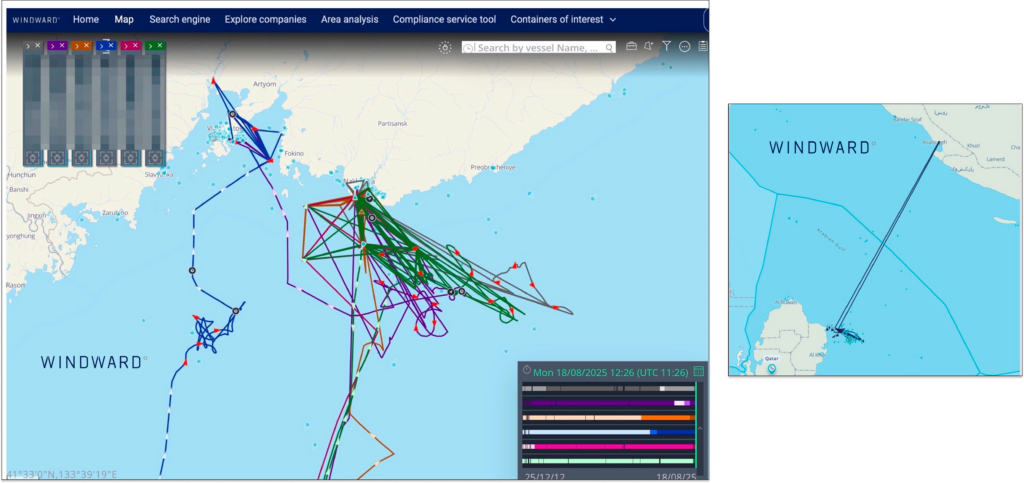
  • A new GPS jamming hotspot was identified in Q3 2025 at Nakhodka Bay, Russia’s eastern Pacific port. More than 600 vessels were affected there and at the nearby Kozmino oil terminal.
  • GPS jamming incidents in Q3 2025 were up 510% from Q1, underscoring how quickly this major threat to navigation and safety has become entrenched in maritime risk.
Jamming patterns in the Nakhodka Bay (left) during Q3 2025 and recent electronic interference off Qatar. Source: Windward Maritime AI™ Platfrom

Crude Oil Exports (In Collaboration with Vortexa)

  • Preliminary data show that crude and condensate exports averaged 43.1 million barrels per day in Q3 2025, exceeding pre-pandemic levels for the first time as the OPEC+ cartel continued to unwind production cuts.
  • September exports averaged 45.5 million barrels per day — the highest since April 2020, when Saudi Arabia briefly flooded the market during a short-lived price war that ended as global demand collapsed. Spot freight rates for the largest tankers temporarily surged above $100,000 per day last month.
  • The largest quarter-on-quarter export increases came from Russia (+250,000 bpd), the UAE (+220,000 bpd), and Saudi Arabia (+40,000 bpd).
  • Saudi Arabia exports registered a month-on-month gain of 700,000 bpd in September to reach 6.7 million bpd, the highest since April 2023.
  • Russian crude exports averaged 3.9 million barrels per day in Q3 2025, up from 3.4 million bpd in September 2024.
  • The rise, roughly half a million barrels per day, followed Ukrainian drone attacks that left more than 1 million bpd of domestic refining capacity offline, diverting more crude to export markets.
  • Stockpiling pushed China’s seaborne crude imports 13% higher year over year in Q3 2025, reaching an estimated 10.8 million bpd — roughly unchanged from the previous quarter.

Strategic Port Insights for Smarter Maritime Container Logistics


  • Ongoing U.S.–China tariff tensions intensified global turbulence in Q3 2025, compounding disruption across maritime container logistics already strained by Houthi-led Red Sea attacks.
  • Counter-seasonal surges in consumer goods exports from China to the U.S., driven by shifting tariff deadlines, continued to distort freight rates, disrupt supply chains, and redirect shipments toward European markets.
  • Ahead of the October 14 implementation of U.S. port fees on Chinese-owned and operated vessels, container lines recalibrated sailings to minimize exposure. Following an early summer peak, U.S.-bound container volumes plunged, prompting widespread blank sailings as carriers sought to manage capacity and stabilize rates.
  • Rotterdam, Yantian, Busan, and Singapore recorded the highest quarter-on-quarter exception rates, respectively.
  • At Rotterdam, exceptions tracked by Windward surged 51% quarter on quarter and stood 35% higher year over year. Key drivers included a 39% rise in insufficient transshipment time, a 35% increase in transshipment delays, and a 24% uptick in rollovers, where containers miss their scheduled vessel.
  • Exceptions peaked in July as European ports contended with congestion, rerouted Red Sea traffic, and labor shortages.
  • Average loading port delays fell at Shanghai, Hong Kong, and Rotterdam, but rose at Busan and held steady in Singapore. In Singapore specifically, transshipment delays climbed 28% from the prior quarter, while routing deficiencies increased 20%.

False Flags


  • In Q3 2025, the number of vessels registered under false flags increased by 22%, highlighting the continued expansion of fraudulent registry activity.
  • By Q3 2025, the number of falsely flagged vessels had doubled since January, highlighting the rapid escalation of deceptive registration practices.
  • During Q3 2025 four newly identified fraudulent registries emerged:
    1. Tonga
    2. Maldives
    3. Mozambique
    4. Angola 

Western governments pressured countries that outsource their ship registries to private operators to remove sanctioned vessels, triggering record levels of flag-hopping and a growing shift toward fraudulent registries.


  • In Q3 2025, global drifting activity over strategic underwater cables and pipelines fell 2.6% from Q2 but remained 53% higher year over year, indicating the persistence of potentially high-risk maritime behavior.
  • In Taiwanese waters, drifting and anchoring activity stabilized quarter on quarter, while the Mediterranean recorded a 28% decline.
  • Slow-speed anchoring and drifting directly above Baltic Sea undersea cables and pipelines — excluding Nord Stream and Nord Stream 2rose 22% from the previous quarter, although the number of unique vessels involved remained steady.

Dark & Gray Fleets


  • 64% of the Windward-identified dark fleet* is now sanctioned by global regulators — rising to 71% among crude tankers over 80,000 DWT.
  • The beneficial owners of 60% of these vessels remain unknown.
  • Russia, Panama, and Comoros continued to dominate as the top three flag registries used by the dark fleet, though the number of Panama-flagged vessels fell 25% quarter on quarter.
  • Gambia entered the top 10 dark fleet registries for the first time. Together with Sierra Leone, these two registries displaced Barbados, Gabon, and the Cook Islands, whose maritime authorities have adopted policies to delete Western-sanctioned vessels.
  • Excluding the national flags of Iran and Russia, the top three registries used by sanctioned vessels in Q3 2025 were Comoros, Gambia, and Sierra Leone.
  • Vessels flagged in Liberia, the Marshall Islands, and Panama accounted for 54% of the grey fleet — the world’s three largest ship registries.
  • Russia, Turkey, and China were the top three port destinations for grey fleet tankers — key hubs for G7 price-cap–compliant oil trades. China remains the largest importer of Russian crude, while Turkey primarily imports Russian diesel and oil.
  • 39% of grey fleet beneficial owners are based in Greece — the world’s largest shipowning nation — reflecting its central role in price-cap–compliant Russian oil trades. Ownership remains unknown for 15% of vessels, the second-largest category, followed by Turkey, China, and Singapore.

Risk Status & Cleared Risk

Cleared Risk


AIS Signal Losses and Port Calls

  • In Q3 2025, 91% of vessels engaged in sanctions-related dark activities were linked to Iran or Russia, underscoring their dominant role in driving global deceptive shipping practices.
  • As U.S. sanctions on Syria are lifted and the country re-emerges as a legitimate trading partner, deceptive shipping activity in the region has declined sharply. Q3 2025 recorded a 44% drop in sanctions-related dark activities linked to the Syrian regime.
  • Conversely, as sanctions pressure on Venezuela intensified, Q3 2025 saw a 45% increase in dark activities linked to the Venezuelan regime.
  • Port calls to Syria rose 28% in Q3 2025 compared with Q2, reflecting the impact of the gradual lifting of sanctions on the regime.

A Bumpy Q4 Ahead

There are no indications that the volatility and disruption defining Q3 2025 will ease, as U.S.–China trade tensions reignite, the Russia–Ukraine war approaches its fourth year, and maritime security threats remain elevated across the Red Sea, Baltic, and Black Sea regions.

Port tariffs imposed by the U.S. and China on each other’s fleets, alongside expanding sanctions regimes, are compounding supply chain inefficiencies and logistics imbalances already embedded in global trade. These pressures are expected to drive up freight costs through the remainder of 2025 and into 2026.

Container lines serving Asia–Europe routes are now reassessing a return to Red Sea transits, contingent on a fragile peace in the Middle East and a sustained halt to the Houthis’ two-year campaign against Western-aligned vessels.

The maritime market outlook remains inseparable from geopolitical developments. Effective risk management will depend on resilience amid intensifying operational, political, and sanctions-related pressures.