


May 27, 2026
Monitoring a Fleet You Can't Find: The Marine Insurance Challenge in a Dark-Activity Era


One Month of War in the Gulf: Mapping the Global Maritime Disruption

What’s inside?
At a Glance
- The Strait of Hormuz has shifted from open transit to a controlled, permission-based corridor, with selective access and emerging denial patterns.
- Commercial shipping has not resumed normal operations, with traffic remaining far below baseline and increasingly concentrated among high-risk or authorized vessels.
- The Gulf has become a congested holding and staging environment, with hundreds of vessels waiting, rerouting, or repositioning rather than transiting.
- Global shipping routes have structurally adjusted, with sustained Cape of Good Hope diversions and partial, volatile recovery through Bab el-Mandeb and Suez.
- Energy markets are fragmenting, with Iranian exports remaining comparatively stable while Iraqi output collapsed and Saudi flows rerouted via the Red Sea.
- Electronic interference has scaled, affecting more than 1,650 vessels and degrading navigation and compliance visibility across the region.
- Shadow fleet and deceptive shipping practices have expanded, exploiting reduced visibility and fragmented enforcement conditions.
- Maritime risk is now multi-theater, extending beyond the Gulf into the Red Sea, Indian Ocean, Black Sea, and global enforcement environments.
- The risk of simultaneous disruption across Hormuz, Red Sea routes, and alternative corridors is increasing, creating systemic exposure across global trade.
The First Month of the Iran War at Sea
One month after the launch of Operation Epic Fury, the maritime system is no longer reacting to disruption. It is operating within it.
The first days of the conflict triggered an immediate collapse in commercial confidence. Tankers halted, insurance coverage was withdrawn, and transit through the Strait of Hormuz fell to near zero. Vessel strikes, GPS jamming, and infrastructure attacks quickly expanded the risk environment across the Gulf and adjacent waters.
By the second week, this disruption had become systemic. Shipping routes began redistributing globally, energy exports were rerouted or reduced, and port operations started absorbing the pressure of displaced cargo flows.
By the third week, the picture began to evolve. The Strait was no longer simply inactive. Limited movement resumed under tightly constrained conditions. Selective transit became visible, with vessels routing through Iranian territorial waters, often following prior calls at Iranian ports. Activity remained extremely low, but no longer absent, indicating that access was being granted on a case-by-case basis rather than fully restricted.
By the fourth week, this model matured into a controlled system. Transit was no longer just selective, but actively managed. A permission-based corridor north of Larak Island became established, with staged and sequenced vessel movement. Throughput increased modestly, but access became more explicitly filtered, with certain vessels denied passage entirely.
The result is a new operating model for maritime trade under sustained geopolitical pressure: constrained, selective, and adaptive.
The Strait of Hormuz Shifts to Controlled Transit
The most significant shift over the month is the transformation of the Strait of Hormuz.
In the first week, commercial traffic effectively collapsed. Daily crossings fell from typical levels of 70-80 vessels to single digits, with multiple days recording fewer than five transits. Hundreds of vessels held position outside the Strait, and war-risk insurance withdrawal made transit commercially unviable.

By the second week, the Strait remained near a standstill, with only 10 crossings recorded over five days. A large share of vessels continuing to transit were linked to higher-risk operators, including sanctioned or non-Western fleets. At the same time, new behavioral patterns emerged. Vessels began broadcasting explicit nationality identifiers through AIS destination fields, with at least 36 ships signaling messages such as “CHINESE CREW OWNER,” “CHINA OWNER & CREW,” and “IRAQI OWNER,” indicating an attempt to reduce targeting risk through self-identification.
Alongside this, dark vessel activity was being detected inside the Strait, with satellite imagery confirming the presence of large vessels operating without AIS transmission. These signals show that even at this stage, transit was not only limited but increasingly shaped by risk signaling and reduced-visibility operations rather than standard commercial behavior.

By the third week, the picture began to evolve. AIS-transmitting movement continued at very low levels, still far below pre-conflict baselines, while dark transits increased. Selective transit became visible, with vessels routing through Iranian territorial waters instead of standard navigation lanes, often following prior calls at Iranian ports.
SAR imagery of vessels operating in the strait without AIS indicates that actual activity inside the strait was higher than AIS-visible traffic alone suggests. Access was conditional, with movement granted selectively and under reduced transparency.

By the fourth week, this model hardened and became more explicit. Iranian authorities publicly declared that vessels linked to the U.S. and Israel, and their allies, were prohibited from transiting through the Strait of Hormuz, regardless of route or destination. In practice, however, the system continued to operate under a controlled, permission-based corridor north of Larak Island rather than through standard navigation lanes, with staged and sequenced transits.
Access remained selective and inconsistent. While certain cargoes and aligned operators continued to receive clearance, other vessels, including Chinese-owned ultra-large containerships, were denied passage entirely.

Low-visibility movement persisted within this system, with vessels continuing to transit under partial or no AIS transmission, further reducing transparency in an already restricted environment. This indicates that enforcement is not purely rule-based, but discretionary and dynamic.
The Strait is operating as a politically enforced filtering mechanism, where access is determined by a combination of cargo type, ownership profile, and shifting geopolitical alignment.
The Gulf Fills, Freezes, and Adapts
While the Strait of Hormuz shifted from collapse to controlled access, the wider Gulf system did not empty — it accumulated.
In the first week, disruption was immediate but still reactive. Alongside collapsing transit through Hormuz, the electronic environment degraded sharply. More than 1,100 vessels were affected by GPS and AIS interference within the first 24 hours of Operation Epic Fury. Signals were displaced onto airports, critical infrastructure, and inland locations, appearing in circular “crop-pattern” distortions, while at least 35 jamming clusters were identified across the Gulf.

Two interference patterns defined the early phase. Denial zones removed vessels from AIS visibility entirely despite vessels likely operating normally, while injection zones distorted positions, placing ships where they physically were not. By March 4, 44 injection zones and 92 denial areas had been identified.

At this stage, the impact was operational. Navigation reliability dropped, compliance monitoring degraded, and operators began losing confidence in the accuracy of the maritime picture.
At the same time, operators faced immediate uncertainty around how to respond. Long-haul rerouting via the Cape of Good Hope carried significant time and cost implications, while conditions inside the Gulf were still evolving. Rather than commit prematurely, many vessels held position, waiting for clearer instructions on how to proceed.
By the second week, this disruption scaled. More than 1,650 vessels were affected, with jamming extending across Saudi Arabia, Kuwait, the UAE, Qatar, Oman, and Iran. Interference patterns also evolved, shifting from circular distortions to zig-zag displacement, where vessel signals jumped across multiple locations within a single day.

At this point, more than 30 jamming clusters were detected by Windward.
The effect was no longer just degraded visibility, it was creating systemic uncertainty. Vessels could appear hundreds of kilometers from their actual positions, while others disappeared entirely despite remaining physically present.
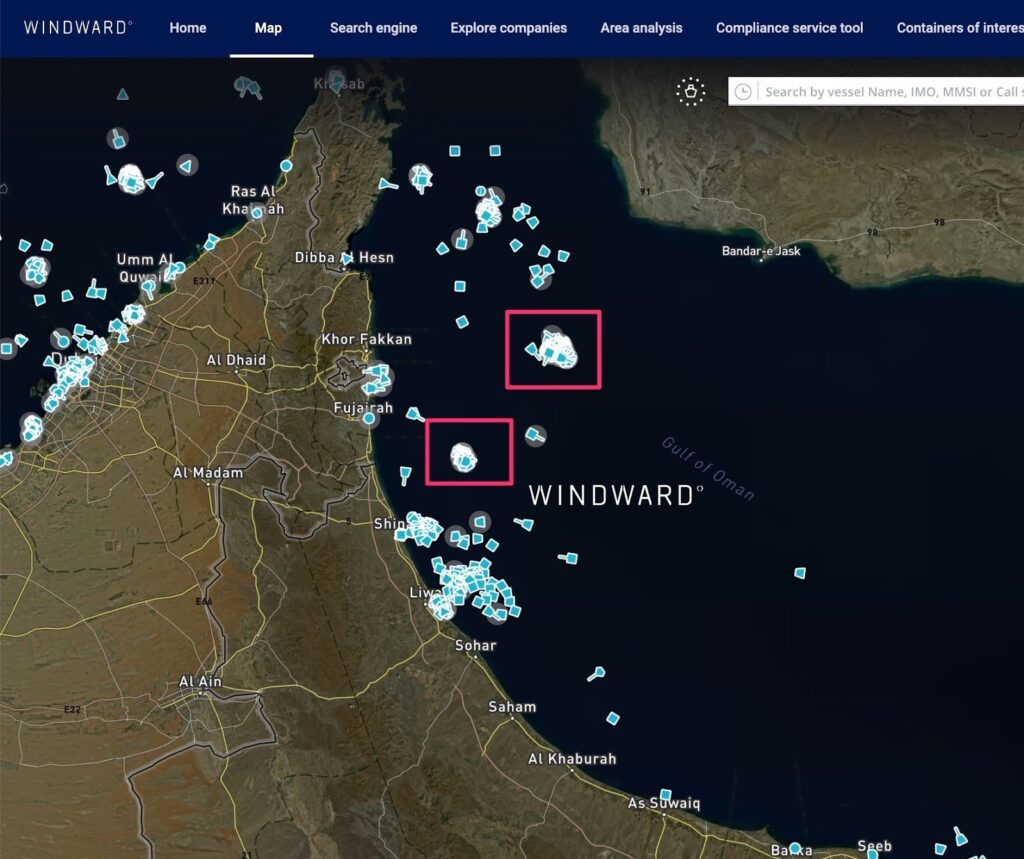
By the third week, the consequences of constrained transit became physical. The Gulf of Oman emerged as a maritime holding zone. Approximately 400 vessels were operating in the area by March 13, with total regional presence reaching 686 vessels by March 22, including 292 tankers and 394 cargo vessels.
Satellite imagery also confirmed vessels operating east of the Strait in floating storage or waiting-to-load patterns, while GPS jamming clusters persisted across the same area.

This buildup suggests that many operators chose to hold position outside Hormuz, rather than commit immediately to long-haul rerouting. The Gulf of Oman effectively became a maritime buffer zone, with vessels waiting for controlled transit access or clearer signals on the duration of the disruption.
By the fourth week, that backlog had not cleared. It had stabilized into a new operating pattern.
Vessel presence across the Arabian Gulf remained consistently high, fluctuating between roughly 600 and 700 AIS-transmitting cargo vessels and tankers.

Vessels were seen staging, anchoring, repositioning, and waiting for clearance. Port calls remained relatively stable, ranging between 247 and 267 daily events, indicating that the system was still active, but no longer fluid.
Throughout the conflict, deceptive shipping practices were consistently evident, particularly within the Gulf. As the system within the region became more structured, these behaviors did not disappear, but became more controlled and less overt.
This is reflected in a decline across several operational indicators:
- Prolonged anchoring dropped from 268 vessels on March 20 to 95 by March 24 before partially rebounding.
- Dark activity declined from 427 to 318 events over five days, suggesting more coordinated visibility management rather than full suppression.
- Identity and location tampering remained steady at 12 to 13 daily cases.
The Gulf remains active under constraint. Physical congestion, controlled access through Hormuz, and degraded and manipulated signals defined how vessels moved, operated, and were monitored across the region.
Global Shipping Routes Reconfigure
As traffic through Hormuz collapsed and then shifted into controlled transit, global shipping routes began to adjust in stages rather than all at once.
In the first two weeks, the clearest signal was the surge in Cape of Good Hope diversions. Traffic around southern Africa rose well above recent averages, with 94 vessels transiting on March 3, 87 on March 4, and 383 transits recorded between March 7 and March 11, averaging roughly 77 crossings per day.
At the same time, traffic through Bab el-Mandeb and the Suez Canal became unstable rather than uniformly collapsing. Bab el-Mandeb fell to just two crossings on March 3, rebounded to 21 on March 4, and remained volatile through the month. Suez throughput also fluctuated sharply, surging to 49 crossings on March 3 before falling to 23 the following day, then showing partial recovery later in the month.
By the third week, the routing picture had become more complex. Cape traffic remained elevated, but some operators began testing shorter routes again when conditions appeared temporarily manageable. Bab el-Mandeb dropped to 10 crossings on March 15 before surging to 38 on March 16. Suez also rebounded from 23 to 39 crossings over the same period. This reflected a more adaptive pattern, with operators recalibrating route choices in real time across multiple contested corridors.
Over the month, global shipping did not settle into a single rerouting response. It split across parallel strategies: sustained reliance on the Cape, selective re-entry into Red Sea-linked routes, and continued hesitation around corridors exposed to both kinetic and signal-layer risk.
Alternative Corridors Take Shape
As direct transit through Hormuz became increasingly constrained, temporary workarounds began to harden into alternative logistics systems.
Saudi Arabia accelerated exports through the East–West Petroline pipeline, redirecting crude away from Gulf loading routes and into the Red Sea. By the second week, Red Sea shipments from Yanbu had surged to approximately 2.47 million barrels per day, a 330% increase from pre-crisis levels. By the third and fourth weeks, this had evolved further, with more than 30 tankers present at Yanbu and 64 crude tankers signaling the port as their destination.

Between March 15 and 21, approximately 22.9 million barrels were loaded, representing a roughly 20% week-over-week increase. Weekly tanker calls at Saudi Red Sea ports also rose materially, confirming that the Red Sea had become a primary alternative export corridor rather than a marginal supplement.

At the same time, Oman emerged as the central logistics workaround for Gulf-bound cargo.

Salalah, Sohar, and Duqm became increasingly important because they sat outside both Hormuz and Bab el-Mandeb threat zones. Despite the March 11 drone strike, destination changes into Salalah rose sharply through March, and this shift was reinforced by pricing, with Shanghai-to-Gulf rates rising 72% in a single week and China-to-Salalah rates increasing independently by 28%.

These diversions gradually became more structured. Mainline vessels discharged cargo in Oman and other alternative hubs, while feeder vessels and overland transport handled onward movement into Gulf markets. Dubai Customs Notice 04/2026 formalized this workaround through a land bridge between Oman and the UAE, while Qatar designated Omani ports as primary substitutes for Hamad.
At the same time, Oman’s role expanded beyond logistics. A formalized strategic partnership with the European Union, combined with renewed Houthi signaling around Red Sea escalation, placed additional geopolitical weight on these routes. As the primary east-west logistics pivot, any disruption at Bab el-Mandeb would further concentrate pressure on Omani ports, freight systems, and regional energy flows.
By the end of the month, these alternative routes had become critical to keeping cargo moving, even as they faced growing operational and geopolitical pressure.
Port and Logistics System Under Strain
As routing patterns shifted, pressure moved downstream into port and logistics systems.
In the first week, disruption appeared immediately in major Gulf hubs. Jebel Ali recorded spikes in late departures, rollovers, and transshipment delays, while Khalifa Port showed even sharper increases, including a 1,300% rise in late departures on a single day. These indicators show that chokepoint disruption was already propagating into cargo handling and scheduling.
By the second week, this pressure expanded across the region. Jebel Ali recorded 19 late departures, 25 rollovers, and 52 delay cases. Salalah experienced the most severe disruption, including 126 transshipment delays and 88 incidents recorded in a single day. Karachi, Hamad, and Shuwaikh also showed rising exception indicators.
In the third week, disruption redistributed rather than cleared. Salalah and Karachi continued to record volatile rollover and delay patterns, while Gulf ports showed intermittent spikes. By March 22, localized easing appeared in some locations, but without broader stabilization.
By the fourth week, the pattern was consistent. Ports were no longer operating as endpoints of stable trade lanes. They were absorbing variability. Routing decisions were being made dynamically, and congestion, delays, and destination changes became embedded in daily operations across both Gulf and non-Gulf hubs.
Energy Flows Under Pressure
Gulf Export Collapse and Redistribution
Energy flows showed immediate contraction following the start of the conflict.
Tanker activity in the Arabian Gulf dropped from 442 vessels in the six days before the launch of Operation Epic Fury to 314 vessels in the six days after the conflict began. Export volumes fell to 8.4 million barrels per day on March 6, down from levels above 30 million barrels per day at the start of the period.

This decline was driven by a complete halt in Iraqi exports and significant reductions from Kuwait and Saudi Arabia, with only partial offset from the UAE, Oman, and Qatar. Iraqi production fell from approximately 4.3 million barrels per day to around 1.3 million barrels per day, while key customer markets such as South Korea and Greece received no cargoes.

Saudi Arabia responded by accelerating exports through the East-West pipeline, reducing dependence on Hormuz, and increasing Red Sea shipments. This shift is reflected in loading activity at Yanbu, where approximately 22.9 million barrels were loaded between March 15 and 21, a roughly 20% increase week-over-week.

Sanctions, Policy, and Market Intervention
Policy actions played a direct role in sustaining flows under disruption.
On March 12, OFAC issued General License 134, allowing Russian crude and petroleum products already loaded onto vessels to complete delivery. The measure applied to approximately 215 million barrels carried by more than 370 tankers. This intervention did not authorize new trade, but it prevented an immediate supply shock by allowing cargo already on the water to reach destination markets.
A parallel dynamic is visible in Iranian flows. OFAC General License U, a temporary waiver allowing the sale of already-loaded crude, has enabled sanctioned cargoes to complete voyages, supporting export continuity despite broader enforcement pressure.
At the same time, sanctions pressure continued to shape behavior. Iranian and Russian exports increasingly relied on opaque ownership structures, deceptive routing, and reduced-visibility operations to maintain continuity. Policy intervention is therefore not reducing flows, but defining how those flows continue under constraint, forcing illicit networks to adapt to the environment.
Iranian Export Continuity Under Constraint
In contrast to other Gulf producers, Iranian exports remained active.
Kharg Island continued operating throughout the conflict, with EO imagery confirming sustained tanker presence and loading activity.

However, export volumes declined from approximately 2.04 million barrels per day before February 28 to roughly 0.98 million barrels per day in the following period, representing a 51.7% reduction in daily export volumes by mid-March. Loading operations continue at Kharg Island, with multiple VLCCs observed loading each week, including sanctioned vessels participating in these flows.
These exports increasingly relied on reduced-visibility behavior. Multiple VLCCs manipulated AIS signals or operated dark, while others broadcast misleading positions inconsistent with observed imagery.
Iran also began testing alternative routes. A VLCC departing Kooh Mobarak carried approximately 1.77 million barrels of crude while remaining in a prolonged AIS blackout. This marks a shift toward reducing reliance on Hormuz by diversifying export pathways.

Sanctions frameworks are also shaping flow continuity. OFAC General License U, a temporary waiver allowing the sale of already-loaded crude, has enabled sanctioned cargoes to complete voyages, supporting export stability despite broader enforcement pressure.
Floating storage is declining but remains elevated at approximately 182.8 million barrels, while in-transit volumes increased by roughly 50 million barrels. This indicates that exports are being sustained by releasing stored supply rather than expanding production.


Russian Flows and Infrastructure Risk
Russian oil flows remained elevated, with total volumes on the water exceeding 250 million barrels.
India and China continued to dominate as destinations, supported in part by OFAC General License 134, which allowed previously loaded cargoes to complete delivery. Approximately 215 million barrels of Russian oil were covered by this waiver, carried by more than 370 tankers in transit or floating storage. Around 44% of those vessels are already sanctioned by the United States, United Kingdom, or European Union, while roughly half are classified as high-risk vessels.

At the same time, infrastructure risk increased. Ukrainian strikes on Primorsk and Ust-Luga disrupted operations, with Primorsk remaining offline and Ust-Luga operating at reduced capacity. Tankers continued to queue at affected terminals, while AIS suppression was observed in port areas.

These signals indicate that while flows remain active, export infrastructure is becoming increasingly vulnerable.
Refined Products and Secondary Commodities
Disruption extended beyond crude into refined products and industrial commodities.
Strikes on Kuwait’s Mina Al-Ahmadi and Mina Abdulla refineries affected approximately 10% of global seaborne jet fuel exports. No new loadings were observed for more than three days, while multiple cargoes remained trapped west of Hormuz. With global demand at approximately 7.9 million barrels per day, the aviation sector is directly exposed.

LPG exports dropped to approximately 1.5 million barrels over a seven-day period, the lowest level in at least 12 months. LNG presence in the Gulf declined by approximately 17%, while container activity remained below baseline.

Dry bulk disruption also intensified. Approximately 280 bulk carriers were effectively trapped in the Gulf, affecting exports tied to 18% of global iron ore pellet supply and 10% of primary aluminum production.

Fertilizer flows toward East Africa also declined sharply, with 86% of vessels on that route ceasing operations.
Global Spillover Effects
The impact of the disruption extended beyond the Gulf and the immediate conflict zone.
Venezuelan exports showed a sharp decline in AIS-visible tanker activity, falling by 67% from 2025 baseline levels. At the same time, physical vessel presence at export terminals remained stable, indicating increased reliance on dark fleet operations.
Cuba experienced a severe contraction in fuel supply, with only 11 tanker arrivals recorded at the beginning of March compared with 53 in January. By the end of the month, only one tanker was signaling Cuba as a destination, while satellite imagery detected dark vessels at key terminals.
Subsea infrastructure was also affected. Work on the Pearls segment of the 2Africa cable project was suspended under force majeure, marking an extension of disruption into digital infrastructure.
These signals confirm that the disruption is not contained within a single region or sector. It is propagating across global trade, energy supply, and infrastructure systems simultaneously.
Naval Mines Threat Raises Risk
During the second week of the war, U.S. intelligence indicated that Iran may begin deploying naval mines in the Strait of Hormuz. While initial deployment could involve only dozens of mines, Iran is estimated to hold up to 2,000 and retains active minelaying capability.
Even a limited deployment would be enough to disrupt traffic. The presence of mines alone can render the Strait unsafe, as clearance requires specialized vessels and coordinated naval operations. In practice, this could halt commercial movement without a formal closure.
U.S. forces have already targeted suspected minelaying vessels in the region, signaling that counter-mine efforts are underway.
Market reaction was immediate, with oil prices rising by roughly $10 per barrel. The risk is clear. A small number of mines could shut down one of the world’s most critical energy corridors.
It is still not clear whether mines, which can sink vessels of all types if activated, have been deployed in the Strait of Hormuz.
Vessel Attacks and Infrastructure Strikes Expand Across the Region
Across March, confirmed incidents affected more than 22 commercial vessels and at least 10 energy and port infrastructure sites across the Strait of Hormuz, the Arabian Gulf, the Gulf of Oman, Bahrain, and the Northern Arabian Gulf.
Early attacks on March 1-4 targeted tankers, bulk carriers, and container vessels across Hormuz, the Gulf, and Bahrain, including vessels at anchor and in transit. By March 6, support vessels were also struck, including a tug assisting a damaged ship.
The threat extended beyond vessels into infrastructure. On March 7, an offshore drilling rig in the Arabian Gulf was struck by a UAV. Later in the month, incidents impacted energy-linked and port-adjacent operations, including damage near Ras Laffan and continued exposure around key anchorage zones such as Fujairah.

Military presence across the Gulf remains significant, with more than 100 naval and law enforcement vessels deployed, including firefighting and response units clustered around incident zones. This indicates sustained operational activity, including events that may not be fully reported.
Despite this escalation, international response remains limited. No coordinated escort framework has been established by major actors such as the EU, NATO, Japan, or South Korea, leaving commercial shipping exposed.
At the same time, risk is expanding beyond a single region. An Indian warship escorted LPG tankers in the Gulf of Oman following transit through Hormuz, reflecting a shift toward selective, voyage-specific protection. In parallel, renewed Houthi signaling points to potential escalation in the Red Sea, increasing risk at Bab el-Mandeb, while Oman’s growing role as a logistics hub increases its exposure.
Attacks span vessels, infrastructure, and multiple maritime zones. Risk is no longer localized. It is multi-theater, interconnected, and aligned with both military activity and commercial routing.
Outlook
One month into the Iran war, the maritime system is operating under sustained constraint rather than moving toward stabilization.
Hormuz is unlikely to return to open commercial transit in the near term. The controlled corridor model is now established, with access shaped by geopolitical alignment, cargo type, and ownership structures.
Global shipping will continue to rely on alternative routing, including Cape diversions, Red Sea corridors, and Oman-based logistics systems. These workarounds will scale, but they introduce new vulnerabilities as risk expands into adjacent regions.
Energy markets will remain uneven. Iranian exports are holding under constrained conditions, while other producers face structural disruption. Secondary impacts across LPG, jet fuel, and fertilizer indicate that broader supply chains are already under pressure.
Operational visibility will remain degraded. Electronic interference and deceptive shipping practices are now embedded features of the environment, requiring multi-source intelligence to maintain situational awareness.
The system is not recovering. It is adapting under sustained constraint.
Explore more

Three Months Into Operation Epic Fury: How Iran Restructured Hormuz Instead of Closing It
At a Glance Operational Overview Hormuz transits remain at approximately 6% of their pre-conflict baseline, and the residual flow is increasingly Iranian-flagged, dark, or hugging Iranian territorial waters. IRGC small-craft counts have moved decisively off the Iranian shore and into the open strait body, with the swarm now positioned within visual range of every commercial...
Read more

Trump Says Hormuz Will Open: A Deal Takes Shape as Iran Expands the PGSA
At a Glance Operational Overview The Hormuz operating environment moved through one of its most consequential five-day windows of the conflict between May 20 and May 24, with Iranian administrative escalation, sustained U.S. enforcement, partial export recovery, and the first publicly announced diplomatic framework all advancing in parallel. Iran’s PGSA extended its claimed zone to...
Read more

Iran Loads East of Hormuz: A New Export Node, a Live Toll Regime, and U.S. Enforcement at Sea
At a Glance Operational Overview The Iranian export environment shifted on two axes across May 19 and May 20, including an offshore crude loading node that has been activated on Iran’s Gulf of Oman coast outside the Strait of Hormuz, and U.S. enforcement has broadened into a parallel campaign across at-sea seizures, OFAC designations, and...
Read more

Hormuz Becomes a Holding Queue: Iran’s Toll Regime, Bilateral Carve-Outs, and a Bifurcating Strait
At a Glance Operational Overview The Strait of Hormuz has structurally shifted from a transit corridor with disrupted flow to a tanker holding queue with administrative governance layered on top. Two developments across May 17 and May 18 define the phase change: Iran’s move to formalize a sovereign transit-toll regime under the Persian Gulf Strait...
Read more

Iran’s Hormuz Transit Toll Mechanism and What It Means at Sea
On May 16, 2026, the chairman of Iran’s Parliament National Security and Foreign Policy Committee, Ebrahim Azizi, confirmed that Tehran will “unveil soon” the full details of a new mechanism to regulate maritime traffic through the Strait of Hormuz, including fees collected for what Iranian officials describe as “specialized services.” The mechanism is administered by...
Read more